- /
- Galleries /
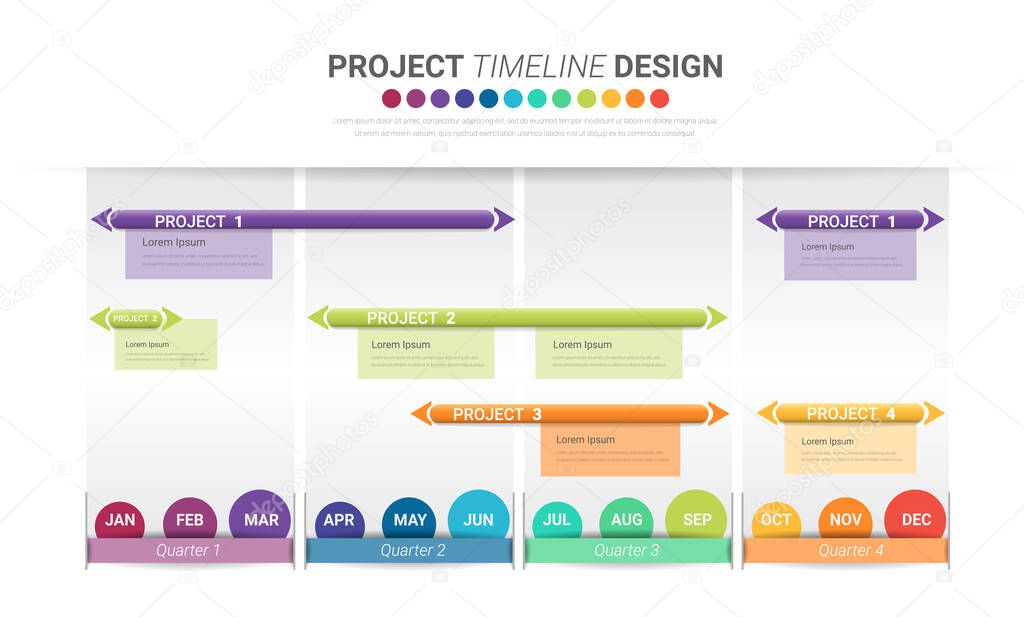
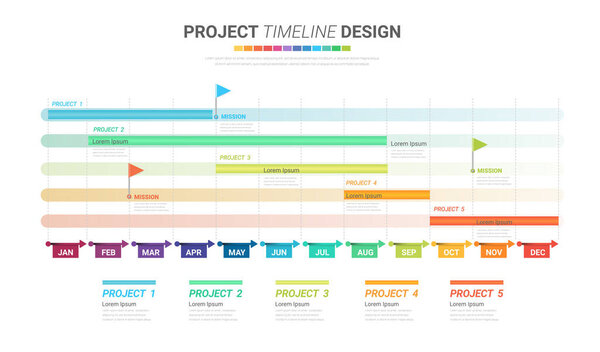
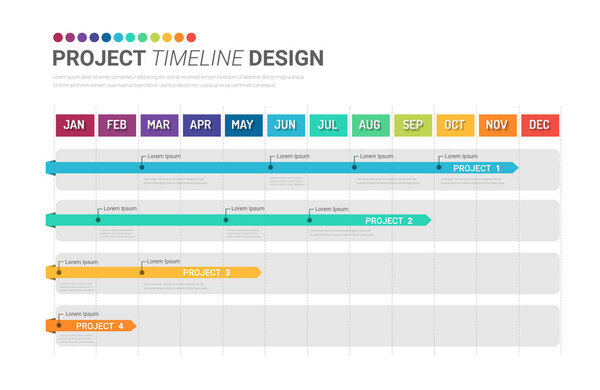
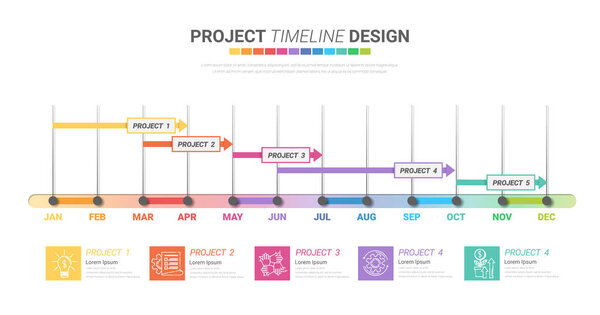
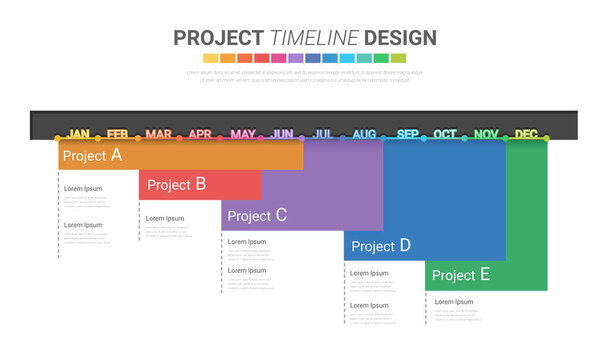
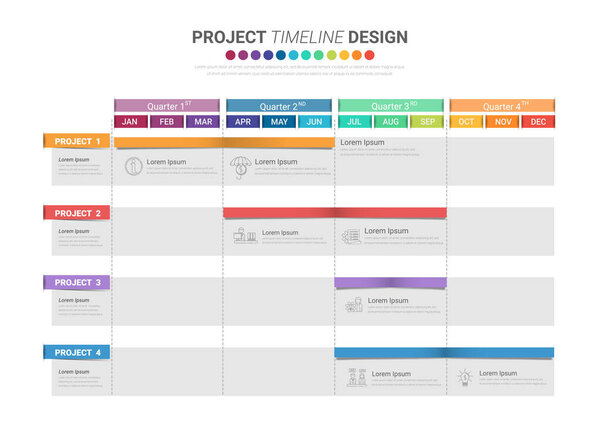
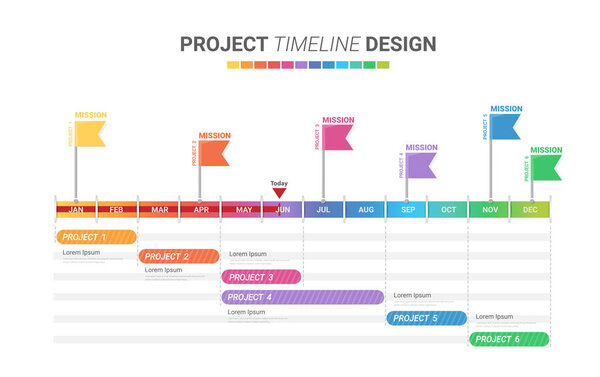
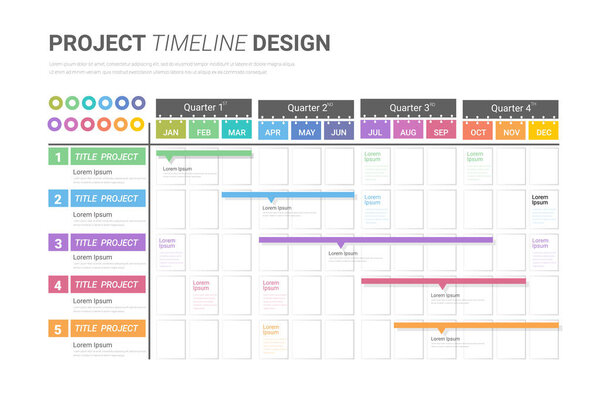
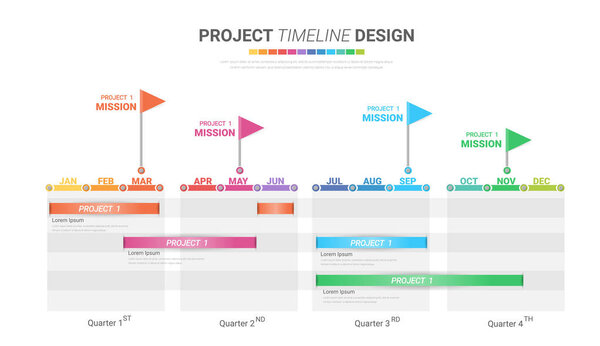
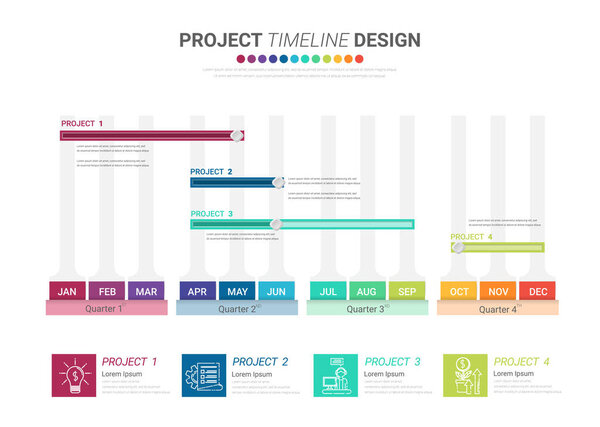
- Project timeline graph for 12 months, 1 year, All month planner design and Presentation business project.
Project timeline graph for 12 months, 1 year, All month planner design and Presentation business project.
Project timeline graph for 12 months, 1 year, All month planner design and Presentation business project.
vector
vector
Dec.05, 2022 03:34:35
31.86
0.60
301x500
602x1000
1204x2000
4380x7273
4380x7273
17
0
Auchara
BAR VECTOR GRAPHIC ILLUSTRATION BUSINESS DETAIL TIME DATE CONCEPT ICON STRUCTURE COMMUNICATION DOCUMENT NOTE PLANNING INFORMATION PRESENTATION PROJECT TEMPLATE FUTURE LAYOUT SHEET PLAN EXECUTIVE REPORT TEAM CONTROL TEAMWORK GRAPH MANAGEMENT CHART MONTH SCHEDULE SCHEME PROGRESS MANAGE DIAGRAM RESOURCE FORECASTING PROGRAM DURATION TASK PERIOD MILESTONE TIMESCALE TIMELINE INFOGRAPHIC 1 YEAR 12 MONTHS ALL MONTH

